Definition
The ABC analysis is a controlling tool used to prepare decisions on business management questions. For this purpose, objects are divided into three categories (A, B, C) (“customer classification”). The objects can be, for example, products, customers or markets.
The objects are described using a relevant key figure (e.g. share of total annual revenue or total annual costs) and sorted in descending order based on this key figure. The sorting produces a list in which the most important object (A) is at the top and the least important object (C) is at the bottom. The ABC analysis thus makes it easy to identify objects that are important for the business. In this way, key accounts responsible for a large share of revenue can be identified, or expense items that significantly drive the costs of a product.
The list entries are then categorized into A, B and C objects based on their cumulative share of the key figure. The following classification is usually used:
| Share of the object in the key figure | Category |
|---|---|
| The first 80 % | A |
| The next 15 % | B |
| The last 5 % | C |
Example: customer analysis
The ABC analysis is illustrated using the example of a customer analysis: the company in question asks itself which customers are particularly valuable for its revenue and which cause more costs than the revenue justifies.
To answer this question, the individual customers are first sorted in descending order according to their share of the company’s total annual revenue. This could look as follows, for example:
| Customer name | Customer’s share of total annual revenue |
|---|---|
| Customer 1 | 50% |
| Customer 2 | 25% |
| Customer 3 | 12% |
| Customer 4 | 7% |
| Customer 5 | 4% |
| Customer 6 | 2% |
The revenue shares are then accumulated in a further column:
| Customer name | Customer’s share of total annual revenue | Cumulative share of total annual revenue |
|---|---|---|
| Customer 1 | 50% | 50% |
| Customer 2 | 25% | 75% |
| Customer 3 | 12% | 87% |
| Customer 4 | 7% | 94% |
| Customer 5 | 4% | 98% |
| Customer 6 | 2% | 100% |
The customers can now be divided into A, B and C customers according to the specified categories. To do this, look at the column with the cumulative share of annual revenue. A new category begins at each point where a threshold is exceeded. According to this logic, A customers account for the first 80 % of revenue, B customers for the next 15 % (i.e. cumulative share between 80 % and 95 %) and C customers for the last 5 % (i.e. cumulative share between 95 % and 100 %).
| Customer name | Customer’s share of total annual revenue | Cumulative share of total annual revenue | Category |
|---|---|---|---|
| Customer 1 | 50% | 50% | A |
| Customer 2 | 25% | 75% | A |
| Customer 3 | 12% | 87% | B |
| Customer 4 | 7% | 94% | B |
| Customer 5 | 4% | 98% | C |
| Customer 6 | 2% | 100% | C |
It can be seen that customers 1 and 2 are of great importance to the company because together they account for three quarters of annual revenue. They therefore clearly belong to the company’s A customers. Customers 5 and 6, on the other hand, have no major influence on total revenue. With this insight, decisions in key account management or customer retention measures, for example, can be made.
A heuristic related to the ABC analysis is the Pareto principle, also known as the 80/20 rule. The ABC analysis is well suited to graphical preparation, as it organizes complex information and reduces it to the essentials. It can be applied to almost any key figure.
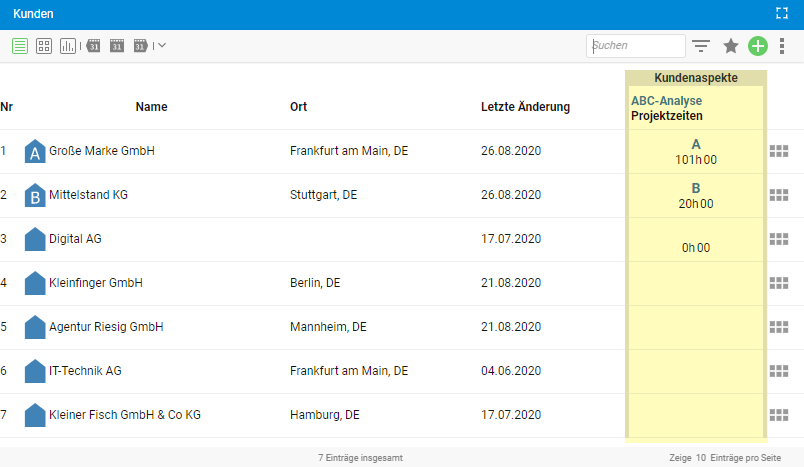
With the ABC analysis in projectfacts, you can classify your customers not only by revenue, but also, for example, by project times. This allows you to see at a glance which customers cause a high project workload and compare this information with their revenue share. In this way, you keep an eye on key accounts and do not lose sight of your profitability.
Further areas of application of the ABC analysis
- Market analysis
- Time management
- Materials management
- Marketing
- and much more