
What is a network diagram? Definition and meaning
The network planning technique is a method that is particularly frequently used in project management for scheduling projects, or sub-projects. It represents the chronological sequence of the individual actions as well as their interdependencies.
A network diagram represents a project as a network of tasks and events that are connected to one another through dependency relationships. From this network, the earliest and latest times of each task, the float and the critical path can be derived by calculation. This makes the network planning technique more closely tied to the logical dependencies of a project than a plain bar chart overview.
Network diagram vs transit map: which one is meant
In everyday language, “network diagram” can also refer to a transit map in public transport, that is, the schematic overview of the underground, bus and rail lines. In this article, however, network diagram means the network planning technique from project management: the graphical representation of a project’s tasks, dependencies and dates.
Tasks of the network diagram
Through network diagrams it is possible to
- Create forecasts for start and end dates, as well as milestones.
- Identify activities that are essential for the completion of the project.
- Make bottlenecks visible early on using the critical path and thereby avoid them.
- Actively build float into the scheduling.
- Give the employees involved a better overview.
Structure of a network diagram
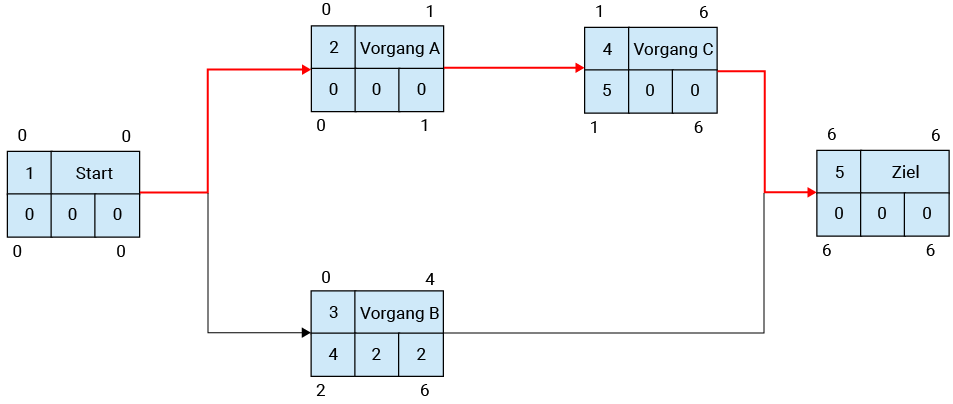
A task in the network diagram is usually represented as a rectangle. It contains the name of the activity and its task number, as well as information about the duration, the earliest and latest start and end times, and details about any possible float. The network diagram also contains so-called predecessors and successors.
The critical path shows the tasks whose float is zero. If a delay occurs there, the entire project is delayed.
The network diagram can be created using forward or backward calculation.
With forward calculation, the earliest start time is considered. This has the advantage that the project is completed before the actual completion date, thus providing a certain buffer. With backward calculation, one starts from the last date by which the project must be finished and thus determines the latest start date.
Activity-on-node and activity-on-arrow network diagrams
Network diagrams can be distinguished by their form of representation. In an activity-on-node network diagram, the tasks sit in the nodes of the network, while the arrows depict only the dependency relationships. This form is the most widely used today and underlies, for example, the metra potential method (MPM).
In an activity-on-arrow network diagram, by contrast, the tasks lie on the arrows, and the nodes represent events, that is, the start or the completion of tasks. This representation is used, among others, by the critical path method (CPM). Alongside these there are event-oriented network diagrams, in which the events take centre stage, as is the case with the program evaluation and review technique (PERT).
Tasks, events and dependency relationships
The building blocks of a network diagram are tasks, events and dependency relationships. A task is a process element with a defined duration, whereas an event is a point in time with no duration, such as a milestone. The dependency relationship determines the logical order in which two tasks stand in relation to one another.
Four types of dependency relationship are common:
- Finish-to-start: the successor starts once the predecessor has been completed.
- Start-to-start: both tasks start in dependence on one another.
- Finish-to-finish: both tasks finish in dependence on one another.
- Start-to-finish: the finish of the successor depends on the start of the predecessor.
These relationships define the logical framework from which the later process plan and the scheduling are derived.
Time calculation in the network diagram: earliest and latest times
The real value of a network diagram comes from the time calculation. In the forward pass, the earliest start and end times of each task are determined from the project start. In the backward pass, the latest start and end times result from the project end.
The float results from the difference between the earliest and latest times. The free float indicates how far a task can be shifted without affecting the earliest start of its successor. The total float describes the leeway available without jeopardising the project end date. All tasks whose total float is zero together form the critical path. It is the longest chain of interdependent tasks and thereby determines the shortest possible project duration.
CPM, MPM and PERT: methods of the network planning technique
Several methods have become established for creating network diagrams:
- CPM (critical path method): activity-on-arrow oriented, with fixed task durations; the classic procedure for determining the critical path.
- MPM (metra potential method): activity-on-node oriented; permits all four dependency relationships and is therefore particularly flexible.
- PERT (program evaluation and review technique): event-oriented; works with estimated, probability-distributed durations and is suited to projects with uncertain time estimates.
In practice, and in project management software, the activity-on-node representation dominates today, because it combines well with the dependencies from predecessors and successors.
Network diagram vs Gantt chart
The network diagram and the Gantt chart describe the same project sequence from two perspectives. The network diagram foregrounds the logical dependencies between the tasks and makes the critical path and the float visible by calculation. The Gantt chart arranges the tasks as bars on a time axis and is therefore readable at a glance, but shows dependencies less explicitly.
In practice, the two views complement each other: the network diagram provides the scheduling logic, the bar chart the clear overview. With the project planning from projectfacts, you plan tasks, dependencies and dates and keep an eye on the critical path.