
Reporting with Power BI
Some questions are best answered with a picture. If you want to present figures from projectfacts graphically, compare them across months or combine them with data from other systems, Power BI is the right place for it.
Enquire nowWhen is Power BI worth having alongside projectfacts?
projectfacts comes with its own reports and already answers the usual questions about budget, utilisation and contribution margin inside the system. For everyday work that is usually enough. Power BI pays off where you need to go further: graphical presentation, comparisons across longer periods and reports cut precisely to your company.
The difference lies in the job each one does. A list answers the question of how things stand right now. A chart answers the question of where things are heading. You need both, but not from the same tool.
What Power BI is the right choice for
Graphical reports
Make developments visible instead of having to read them out of columns of figures.
Monthly and yearly comparisons
How did this month go against the last one, against the same month last year, against the plan?
Reports of your own
Reports you will not find off the shelf, because they answer your questions.
What people typically build with it
Four reports come up particularly often in professional services firms. They are meant as inspiration here, not as a catalogue.
The development over time
Revenue, incoming orders or utilisation over twelve or twenty-four months. A single monthly figure says little; only the series shows whether a weak month was a blip or the start of a trend. The underlying figures sit in project controlling.
The monthly report as a picture
The same key figures, prepared the same way every month, on a single page. Once that is built, every meeting is spared the question of where the figures are, and the discussion about how they came about.
Utilisation and capacity side by side
What is committed against what is available. In a chart you can see at a glance where things are getting tight and where there is room. The planning data behind it comes from resource planning.
Figures from several sources in one picture
This is the real reason many firms use a reporting tool: a report needs data from projectfacts and from another system. In that case it has to be built where the two come together.
How the data gets into Power BI
There are two routes, and neither of them calls for development work of your own.
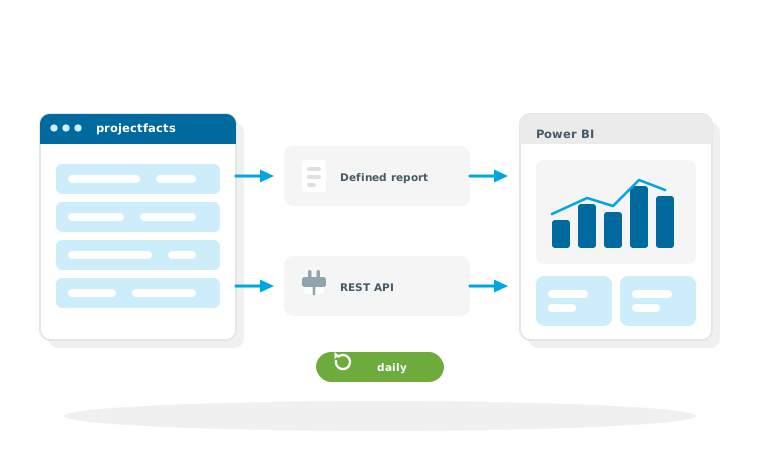
Through a defined report
You decide which fields a report contains and make it available as a download source. Power BI collects the file from there. The advantage: the structure is fixed and does not change just because someone in projectfacts has shown or hidden a column. How that works in detail is described under CSV and Excel export.
Through the REST API
If the report is to decide for itself what it queries, or if several different areas of data are needed, going directly through the REST API is the more flexible choice.
How often the data is refreshed
That is up to you: hourly, daily or on the monthly cut-off date. For most management reports a daily run is enough. Refresh overnight and you have yesterday evening's position in the morning, which is almost always the right reference point.
We help you build it
The hard part of a good report is rarely the technology. It lies in the questions that come first.
What we clarify together
Which key figure answers the question you actually have? Broken down how, by project, by customer, by employee? As at which date, over which period? And which fields in projectfacts really produce that figure? In our experience, that half hour up front saves you the third rewrite of the finished report.
Where we support you
We show you which data can be retrieved from projectfacts and how it is structured, set up the report or the access for it, and stay with you through the first build. Talk to us before you start, not afterwards.
And when Power BI is the wrong answer
If the question is a one-off, an export to Excel will do. If it is different every time, the MCP server may be the better route: an AI assistant answers questions that nobody built a report for beforehand. A reporting tool pays off for what is needed regularly and in the same form.
Your figures as a picture instead of a list
In a free initial consultation we work out which reports you need, which ones projectfacts already provides and which are better built in Power BI.
Request a consultationStill have questions? We have the answer.
Would you like to talk through a particular report, or find out which data can be retrieved? Talk to us, and we will gladly help you build it.